The AI Platform for Equity Research
Deploy agentic AI to expand your coverage, offload manual review, and surface signals faster. Every fact linked back to the filing.


Canvas · Research Dimensions
Research in dimensions, not documents.
Accelerate your research with instant and accurate filings.
Illustrative output — in the live product every cell links to its exact source passage.

The ingestion and reasoning engine to turn filings into conviction at-scale.
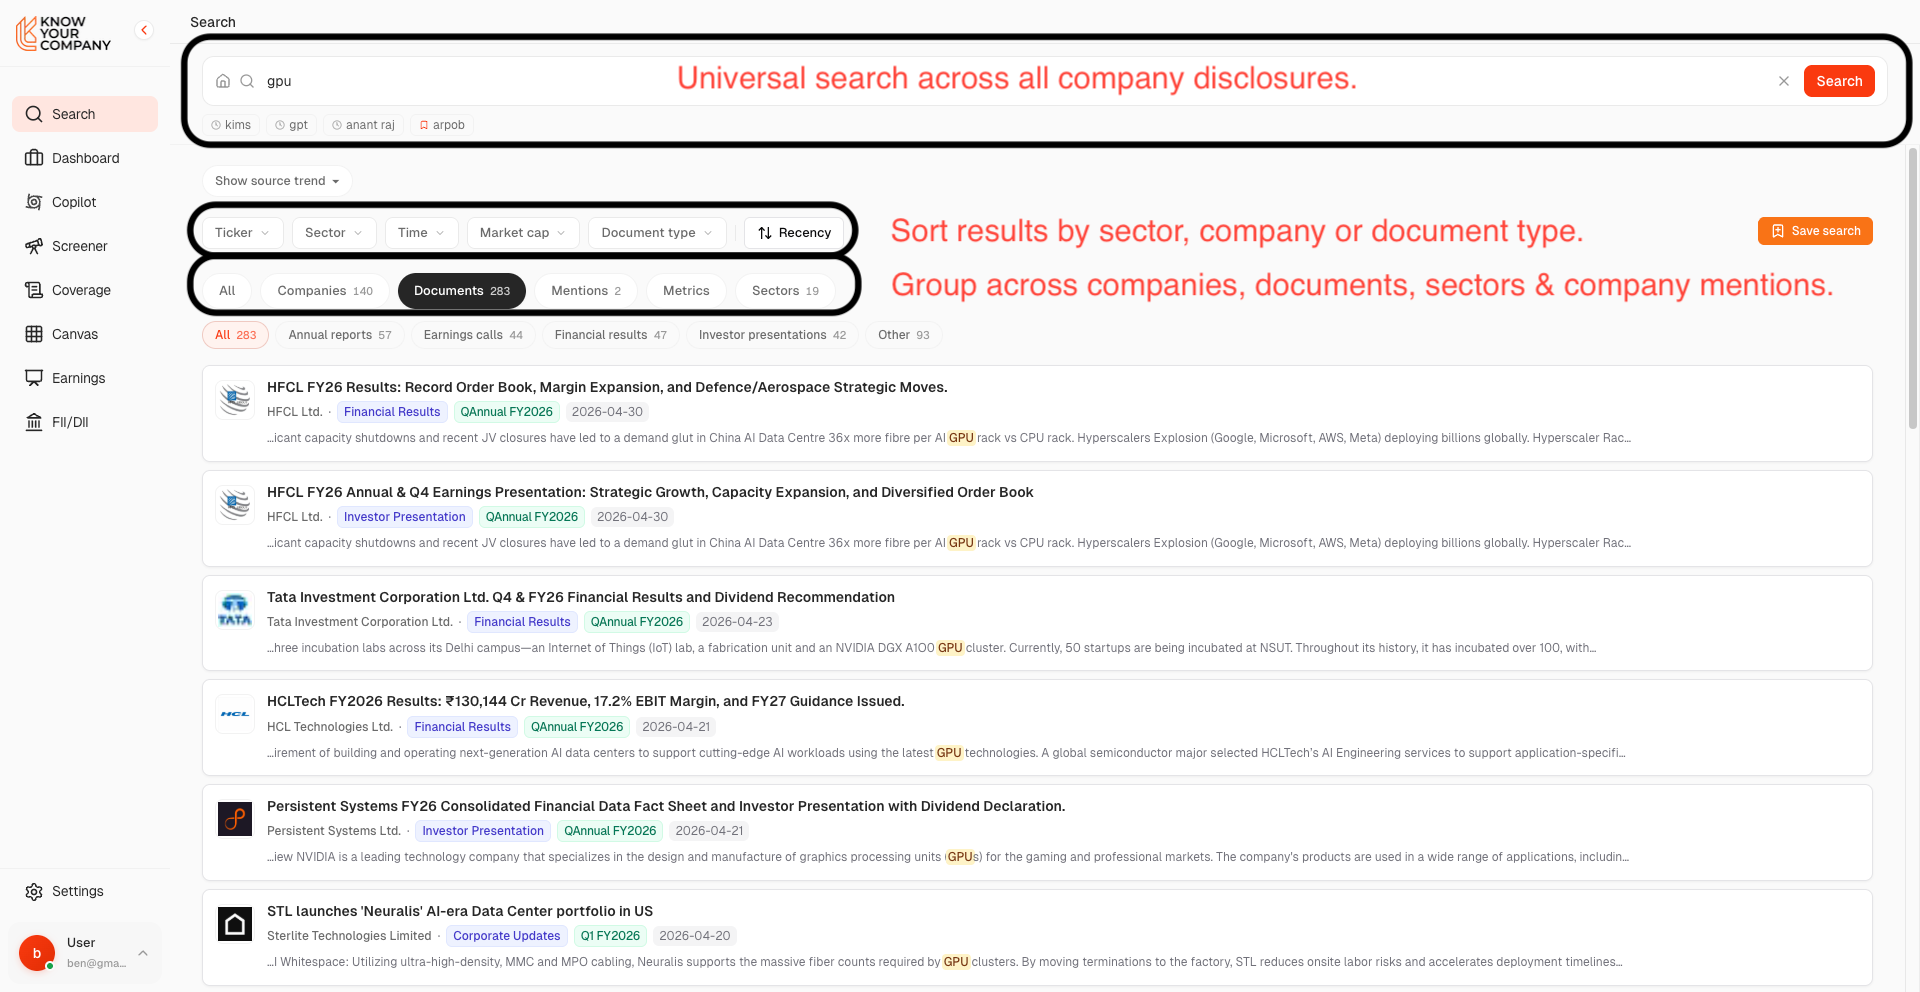
We ingest 100% of every filing, transcript, and disclosure across 2,000+ listings. We learn your coverage and mandate to tailor what surfaces.
KnowYourCompany reasons over the entire entity: every filing, transcript, and disclosure, not a single data point. Built-in linking connects KPIs, segment trends, and management cues across your coverage.
First seen 2 days ago
KnowYourCompany surfaces the signal with source-linked evidence and a recommended next step. Every claim is one click from the original filing.
One product · three lenses
Built for investment teams that need to cover more, faster.
Auto-cover every name in your sector without adding analysts.
Cover 3× more companies, without hiring.
- Auto-updated company profiles across 2,000+ Indian listings
- Earnings, results, and announcements summarised within hours
- Zero manual model maintenance. Refreshes happen on filing day
Every fact links back to the source filing.
Your AI Partner for Faster, Smarter Company Research


24/7 Research Analyst
Hours of research in seconds. Ask about any company metric, trend, or comparison with full citations.

Key Metrics, Zero Effort
Auto-generated financial profiles with every metric that matters, always current and accurate.

Track Markets
Track filings and news automatically. Get instant alerts with AI-summarized insights.

Automated Benchmarking
Compare companies across revenue, growth, and margins, no spreadsheets, no manual work
NVIDIA Inception Program
Selected for the NVIDIA Inception program for AI-driven financial intelligence.
DPIIT, Government of India
Recognized startup under the Department for Promotion of Industry and Internal Trade.
VeritaForge Research Pvt Ltd
Founded by ex-Barclays and enterprise technology leaders with deep capital markets expertise.

Product Hunt
Featured on Product Hunt, the launchpad for the best new products in tech.
Unlock financial AI for your firm
